What are Payroll Charts?
Our payroll charts show the breakdown of pay periods depending on how often you choose to pay your employees.
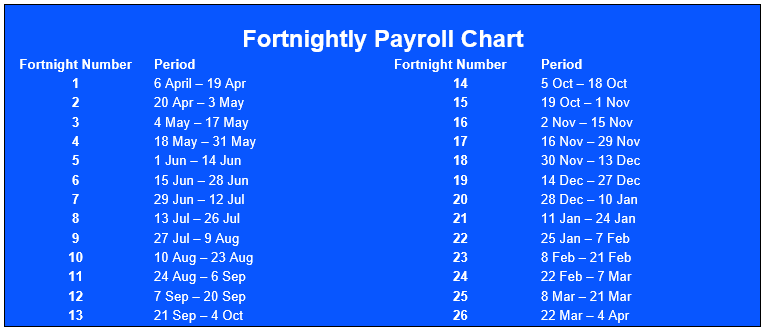
How often employers choose to pay their employees is normally broken down into pay periods within a tax year. The tax year runs from the 6th April until 5th April the following year. If you pay monthly, then you will be paying your employees 12 times over the tax year. If you pay weekly, then you will be paying 52 or 53 (depending on your pay dates) times a year. Below are our charts to help you figure out your pay periods and how this aligns with HMRC.
PAYE Liability
You may also like to familiarise yourself with the monthly payroll chart if you pay employees weekly, fortnightly or 4-weekly as any PAYE liabilities due within the 6th - 5th of the following month would be added together and would need to be paid by the 22nd.
For example, any payments within 6th April and 5th May would need to be paid by 22nd May. To know more about keeping track of your PAYE liabilities in Shape, please see PAYE Liabilities.
Weekly Pay Runs
If you pay weekly on a Friday, then your first pay run of the tax year 2022 will be Friday 8th April 2022. Looking at the chart below, you can see that any pay dates that fall on and between the 6th April and 12th April falls into the 1st pay period of the tax year.

Week 53, 54 or 56
This occurs when you your last pay run of the tax year falls on the 5th April. Please see our help article What is a Week 53 Pay Run? for more details. This may also effect Fornightly and 4 - weekly pay frequencies.
Monthly Pay runs
If you pay your employees once a month, you will want to set up a monthly pay frequency. HMRC also use the monthly pay periods to work out what you owe them.

Fortnightly Pay runs

4 - Weekly Pay runs

Quarterly Pay runs
